
Description
This comprehensive study packet covers 7 standards from the TABE 13/14 Level D math blueprint in the Linear Relationships, Functions & Systems domain.
Every lesson was written with adult learners in mind: real-world contexts, respectful tone, and professionally designed coordinate grid visuals that actually teach.
You get a complete, print-ready resource. Your students get the depth they need to pass.
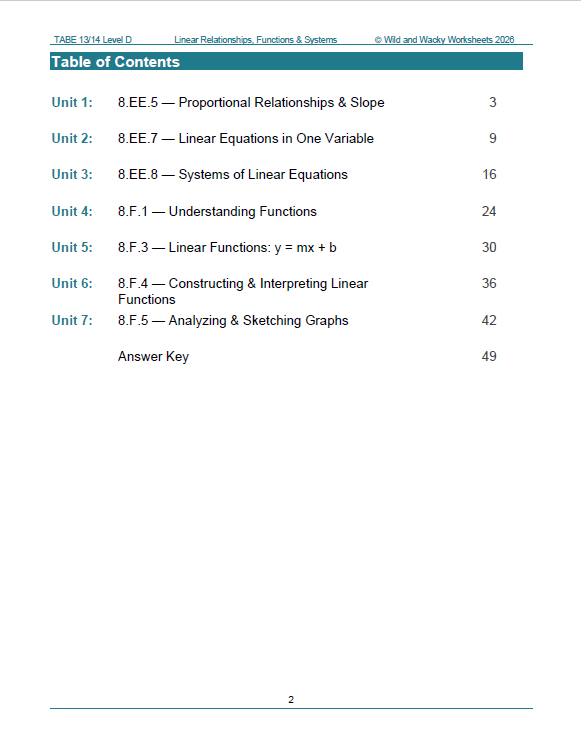
WHAT’S INCLUDED (7 Complete Units)
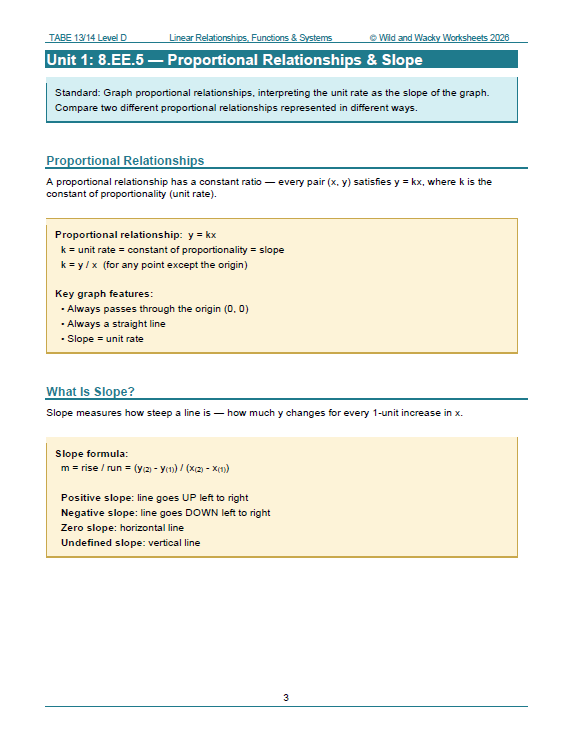
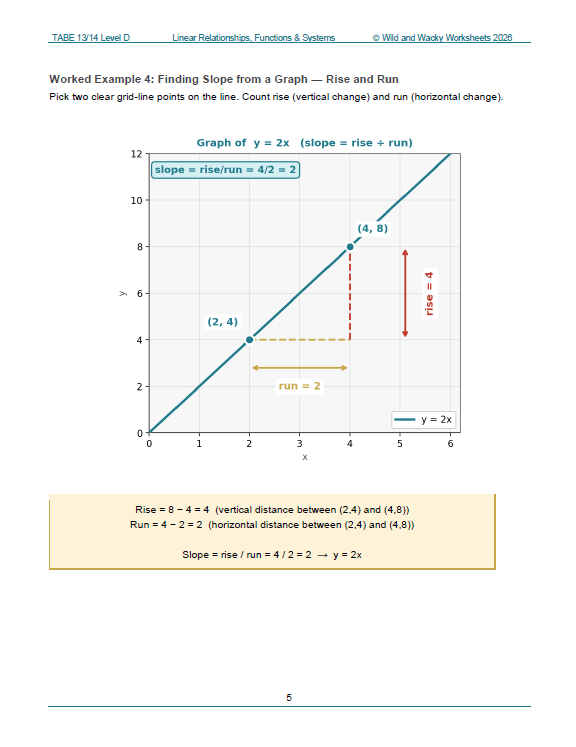
Unit 1 — 8.EE.5: Proportional Relationships & Slope Graph proportional relationships and interpret the unit rate as slope. Compare two proportional relationships shown in different forms (table, equation, graph). Includes a fully labeled coordinate grid showing rise and run with color-coded annotations.
Unit 2 — 8.EE.7: Linear Equations in One Variable Solve linear equations including those with rational coefficients, variables on both sides, no solution, and infinitely many solutions. Introduces the STOP Method (Simplify, Transfer, Operate, Pull) as a solving strategy. Includes number line solution graphs and a real-world break-even graph.
Unit 3 — 8.EE.8a/b/c: Systems of Linear Equations Solve systems by graphing, substitution, and elimination. Identify one solution, no solution, and infinitely many solutions. Includes a fully graphed system showing the intersection point, and real-world applications including break-even and catch-up problems.
Unit 4 — 8.F.1: Understanding Functions Define functions, apply the vertical line test, interpret mapping diagrams, and use function notation. Includes side-by-side vertical line test grids (passes/fails), a mapping diagram visual, and two practice graphs for students to apply the VLT themselves.
Unit 5 — 8.F.3: Linear Functions — y = mx + b Interpret slope and y-intercept in slope-intercept form. Graph lines from y = mx + b. Identify linear vs. non-linear functions from equations, graphs, and tables. Includes a fully annotated coordinate grid with rise/run triangle and labeled key points.
Unit 6 — 8.F.4: Constructing & Interpreting Linear Functions Determine rate of change and initial value from word descriptions, tables, two points, and graphs. Interpret slope and y-intercept in real-world context. Includes a step-by-step coordinate grid showing how to read a function directly from a graph.
Unit 7 — 8.F.5: Analyzing & Sketching Graphs Describe a function qualitatively — increasing, decreasing, constant, linear, non-linear. Sketch graphs from verbal descriptions. Includes four coordinate grid examples: a piecewise walk, a water tank, a car speed trip, and a symmetric piecewise linear function.
PACKET DETAILS
- Pages: 56 pages of instruction and practice
- Problems: 100+ practice problems across all 7 units
- Answer Key: Complete answer key with step-by-step explanations for every problem, including multiple choice rationale
WHO THIS IS FOR
✔ Adult education and GED instructors preparing students for the TABE 13/14 Level D math test
✔ Workforce development and career training programs requiring EFL documentation
✔ Correctional education programs needing self-contained, print-ready materials ✔ ABE/ASE instructors working in the 8.EE and 8.F domains
✔ Students who need structured independent study between class sessions
STANDARDS ALIGNMENT from the TABE Blueprint
8.EE.5 Proportional relationships; unit rate as slope; comparing representations
8.EE.7 Solve linear equations in one variable (all cases)
8.EE.8a Understand solutions to systems graphically
8.EE.8b Solve systems algebraically: substitution and elimination
8.EE.8c Solve real-world problems using systems of equations
8.F.1 Define functions; vertical line test; function notation
8.F.3 Interpret y = mx + b; identify linear vs. non-linear functions
8.F.4 Construct and interpret linear functions; rate of change; initial value
8.F.5 Analyze and sketch graphs qualitatively
You may also like the TABE Level D Geometry study packet.


Reviews
There are no reviews yet.